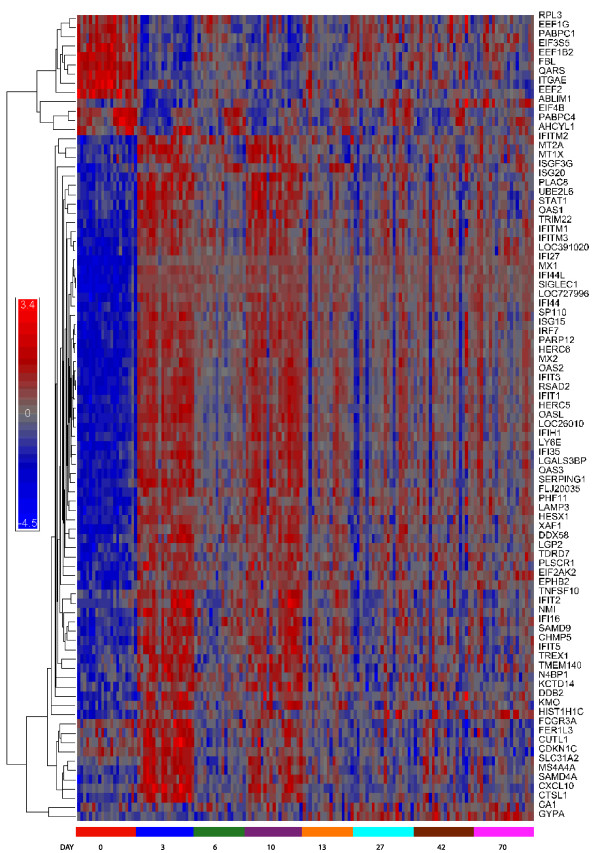
Figure 2.
To illustrate the pattern of expression across time-points, data from the top 90 genes (by p-value) across all time points were clustered by Pearson Dissimilarity. Arrays (horizontal axis) are arranged in the order of time point (day) and within each time point by Non-Responder(NR) and Responder (R) as determined by viral titer at week 72 (final response in table 2). Expression values were normalized after clustering.

