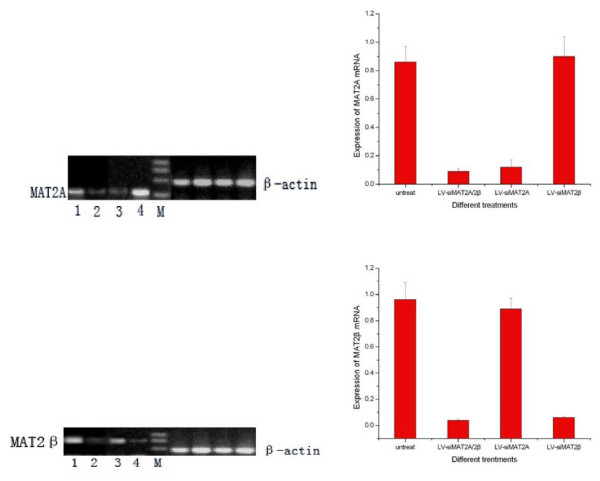
Figure 6.
demonstrated that after HepG2 cells were done with different treatment. RT-PCR was performed to decide the mRNA level of MAT2A and MAT2β, 1 means untreated cells; 2, 3 and 4 stands for doing withLV-siMAT2A/2β, LV-siMAT2A and LV-siMAT2β respectively. It was showed in the Fig 4 that MAT2A and MAT2β were suppressed byLV-siMAT2A and LV-siMAT2β respectively and by LV-siMAT2A/2β simultaneously. LV-siMAT2A has on effect on expression of MAT2β, vice versa.

