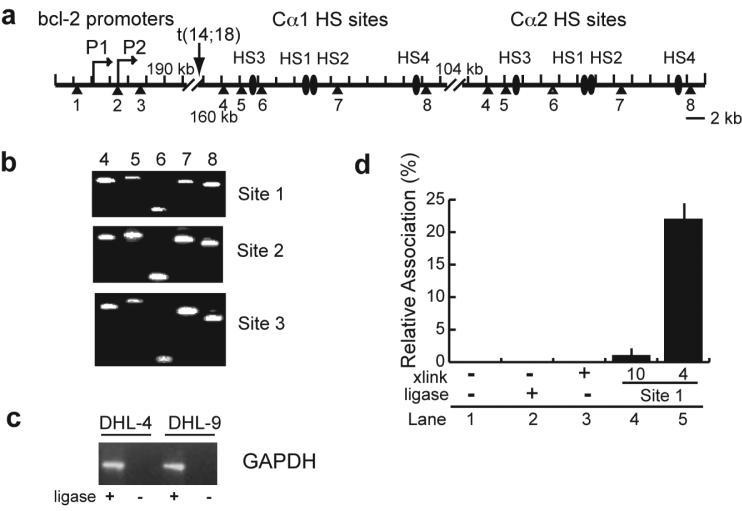
Figure 2. Schematic of the BamHI sites at thebcl-2 promoter region and IgH enhancers, and controls for 3C analysis.
(a) Diagram of the bcl-2 promoters and the IgH 3' enhancers in t(14;18) lymphoma cells. The transcription start sites of bcl-2 (P1 and P2) and the IgH hypersensitive sites (HS3, HS1, HS2, HS4) following Cα1 and Cα2 are labeled. Numbers under each triangle show the BamHI sites in this region. Approximate distances in kilobases are shown at each of the gaps in the diagram.
(b) Agarose gels (2%) showing the PCR products of the 3C analysis of interactions of bcl-2 promoter region BamHI sites 1, 2, and 3 with IgH BamHI enhancer sites 4 through 8 in DHL-4 cells.
(c) Agarose gel showing the PCR products of the 3C analysis of interactions of two BamHI sites in the GAPDH locus in DHL-4 and DHL-9 cells.
(d) Negative controls for 3C analysis in DHL-4 cells. Real-time PCR was performed with bcl-2 promoter region BamHI site 1 primer and probe and IgH enhancer BamHI site 4 primer on non-cross-linked DNA (lanes 1 and 2) and cross-linked DNA before and after ligation (lanes 3 and 5). The primer/probe at bcl-2 promoter region BamHI site 1 was also used in real-time PCR with the IgH locus BamHI site 10 primer (lane 4). (Lanes 4 and 5 utilized cross-linked and ligated DNA.)

