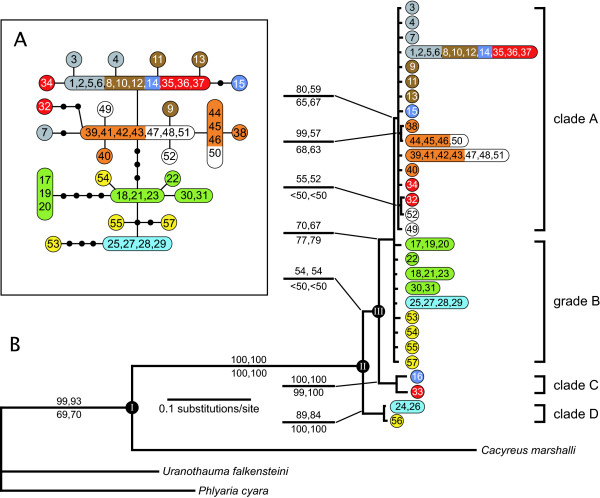
Figure 2.
Relationships among COI+cytB mitochondrial haplotypes of Lampides boeticus. Numbers refer to sample information in Table 1; colors denote biogeographic regions designated in Fig. 1. A. Most parsimonious haplotype network of L. boeticus constructed with 99% connection limit. Black circles indicate extinct or unsampled haplotypes that differ by one nucleotide substitution from the adjoining haplotype. B. Bayesian consensus tree of L. boeticus haplotypes. Numbers above braches indicate Bayesian posterior probability and maximum likelihood bootstrap support, respectively; numbers below indicate parsimony bootstrap symmetric resampling and jackknife support, respectively, for parsimony analyses that resulted in a topologically similar tree. Estimated node ages: I, 6.9 ± 0.6 My; II, 1.5 ± 0.2 My; III, 1.4 ± 0.2 My

