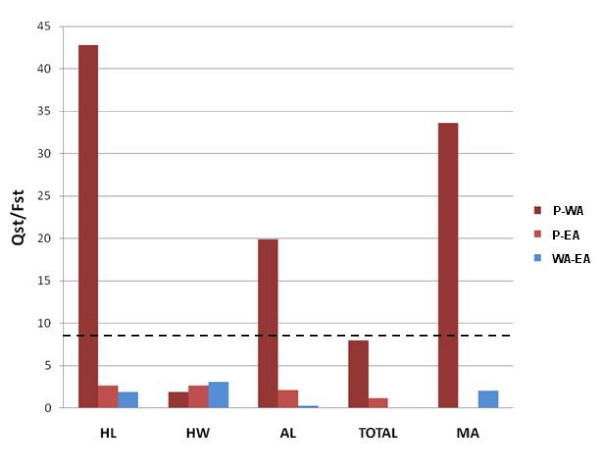
Figure 3.
Pairwise QST/FST for all population pairs and all sperm traits. Atlantic-Pacific comparisons are in different shades of red. Pacific-West Atlantic (P-WA) in dark red, Pacific-East Atlantic (P-EA) comparison in pink, and West-East Atlantic (WA-EA) comparison in blue. Head length (HL), head width (HW), axoneme length (AL), total length (TOTAL), midpiece area (MA). Dashed line represents the lower limit for statistically significant QST/FST (α = 0.05) after Bonferroni correction.

