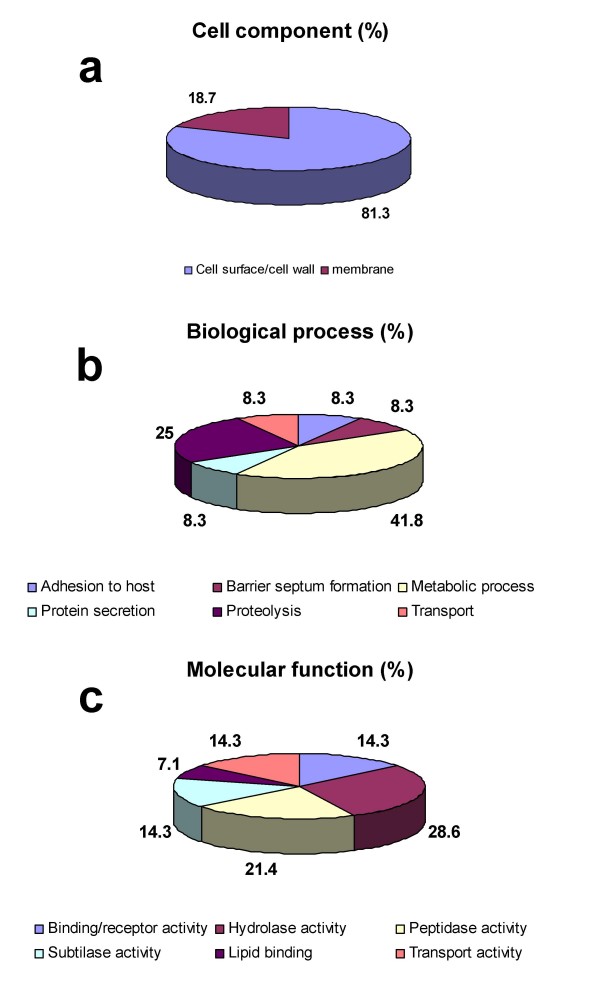
Figure 4.
Gene Ontology (GO) annotation of identifiedproteins. The graphs show the percentages of corresponding GO terms on the total number of annotated proteins. 16 out of 28 proteins (57%) were annotated for "cell component" (a), 12 (43%) for "biological process" (b) and 14 (50%) for "molecular function" (c).

