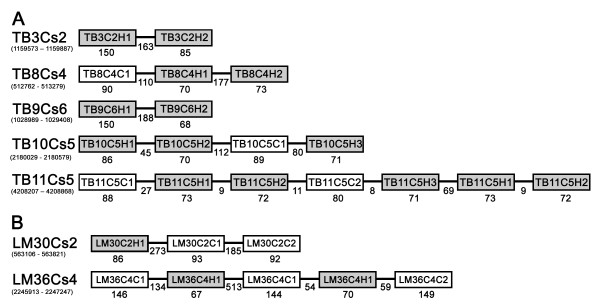
Figure 7.
The schematic structure and location of the predicted clusters. (A) Four novel snoRNA clusters detected in this study in T. brucei. (B) Two clusters detected in L. major. The names of each molecule in the cluster are given according to snoRNA nomenclature in T. brucei and L. major (TB or LM; chromosome number; C, cluster number; C, C/D number or H, H/ACA-like number). The C/D snoRNAs are shown as lightly-shaded boxes, whereas the H/ACA-like RNAs are in dark boxes. Thinner lines indicate an intergenic region, with size indicated below the line. The lengths of snoRNA genes (± 3 bp) are indicated below the box. The small numbers below the name of each cluster indicates the position of the cluster in the genome database of T. brucei GD release 4 [57], and L. major genome release 5 [58].

