
Figure 2.
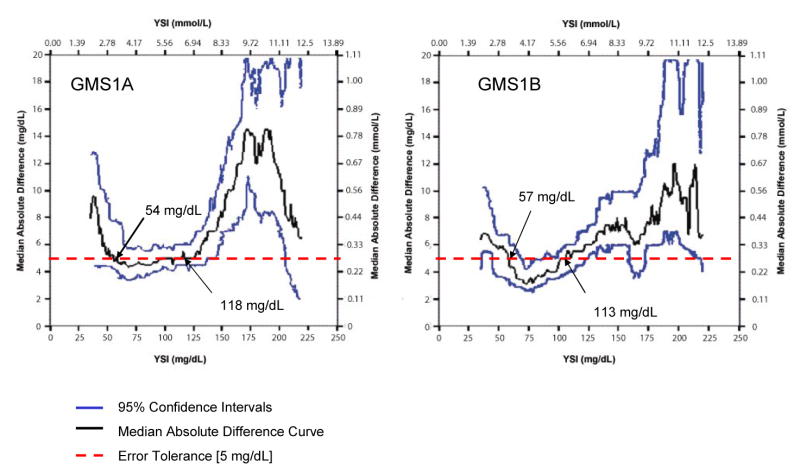
Locally-Smoothed Median Absolute Difference Curve: GMS 1. The graphs show LS MAD curves for GMS 1A and 1B. The 95% confidence intervals appear above and below the curve. The dashed horizontal line at 5 mg/dl represents the recommended error tolerance. Values of reference glucose where the LS MAD curve crosses the error tolerance, so-called “breakout points,” are identified by the black arrows.