
Figure 4.
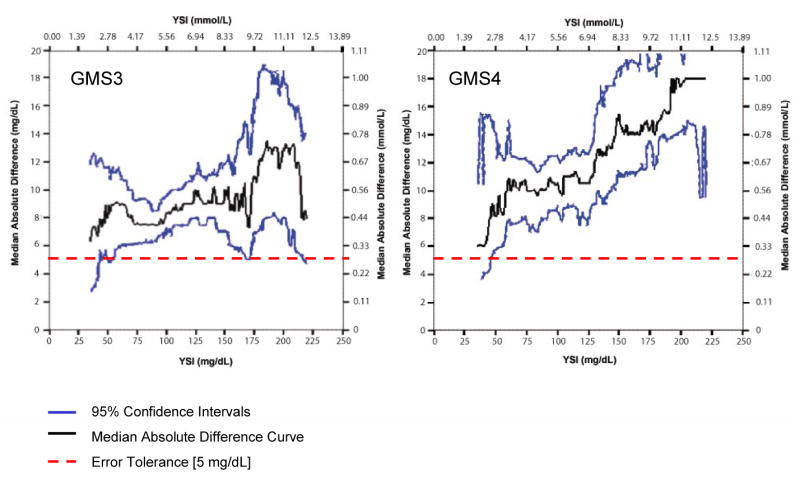
Locally-Smoothed Median Absolute Difference Curves: GMS 3 and 4. LS MAD curves for GMS 3 and 4. The LS MAD curves float above the error tolerance throughout the glucose range from 35 to 220 mg/dl, which reflects paired observations with reference glucose values from 20 to 235 mg/dl. Each system produced one dangerous Class I discrepant value (see Table 2) in the TGC range from 80 to 110 mg/dl.