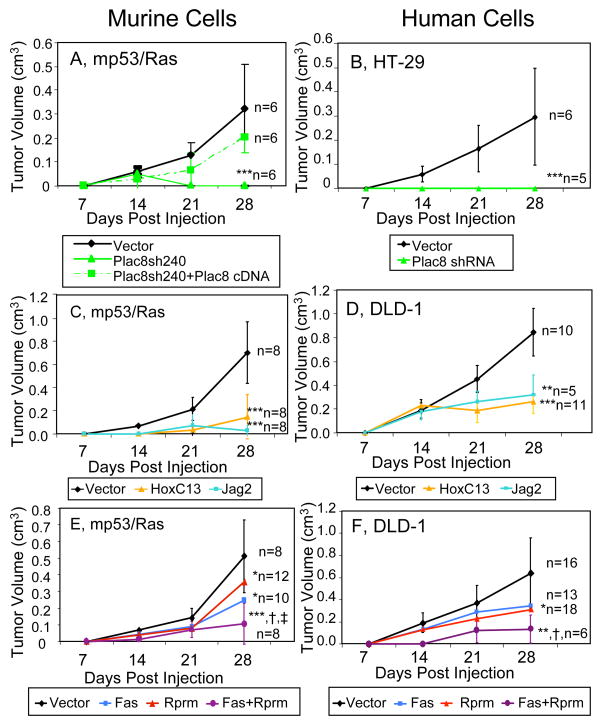
Figure 4. CRG perturbations reduce tumor formation of both mp53/Ras and human cancer cells.
Tumor volume was measured weekly for 4 weeks following injection into nude mice of murine (A, C, E) and human cancer cells (B, D, F) with indicated perturbations. Error bars indicate standard deviation at each time point. Number of injections (n) and significance levels as compared to matched controls are indicated (***, p<0.001; **, p<0.01; *, p<0.05). Significance of tumor reduction upon combined perturbation Fas + Rprm as compared to individual perturbations is indicated as follows: vs. Fas (†, p<0.05), vs. Rprm (‡, p<0.05).

