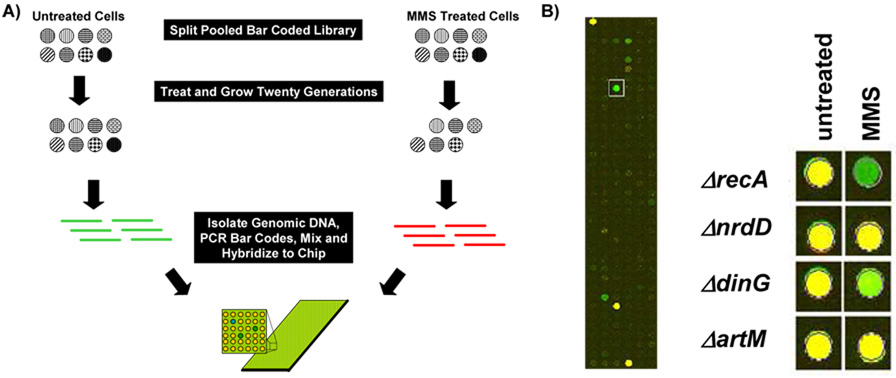
Figure 2. Pooled Experiments with a Microarray Readout.
(A) Theoretical pooled competitive growth experiments using eight molecular bar-coded gene-deletion mutants. In theory the two MMS sensitive mutants will be depleted from the pool after exposure. DNA purified from untreated and MMS-treated pools can then be used in conjunction with Cy3 and Cy5 labeled primers to amplify molecular bar-codes from each pool. The amount of each bar-code in the pools can then be determined by mixing the amplified products, followed by hybridization to a bar-code specific microarray. Green spots on the microarray represent bar-codes depleted in the MMS treated pool relative to untreated samples. (B) We exposed a pool containing 99 molecular bar-coded gene deletion mutants to 0.015% MMS for six hours and then purified total DNA for use in PCR reactions. Cy3 and Cy5 labeled products from the untreated (green) and treated (red) pools were then mixed and hybridized to an Agilent custom array. (Left) A close up of the hybridized microarray with a ΔrecA specific bar-code indicated by a box. (Right) Results for ΔrecA, ΔnrdD, ΔdinG, and ΔartM from hybridizations of untreated vs. untreated (untreated) and untreated vs. MMS treated (MMS) pools. Yellow spots represent bar-codes found at equal levels in each pool, while green spots represent bar-codes enriched in the untreated pool relative to MMS. Note that most spots on the microarray are blank, as only a small fraction of the potential bar codes were utilized by the 99 strains in the E. coli deletion set.

