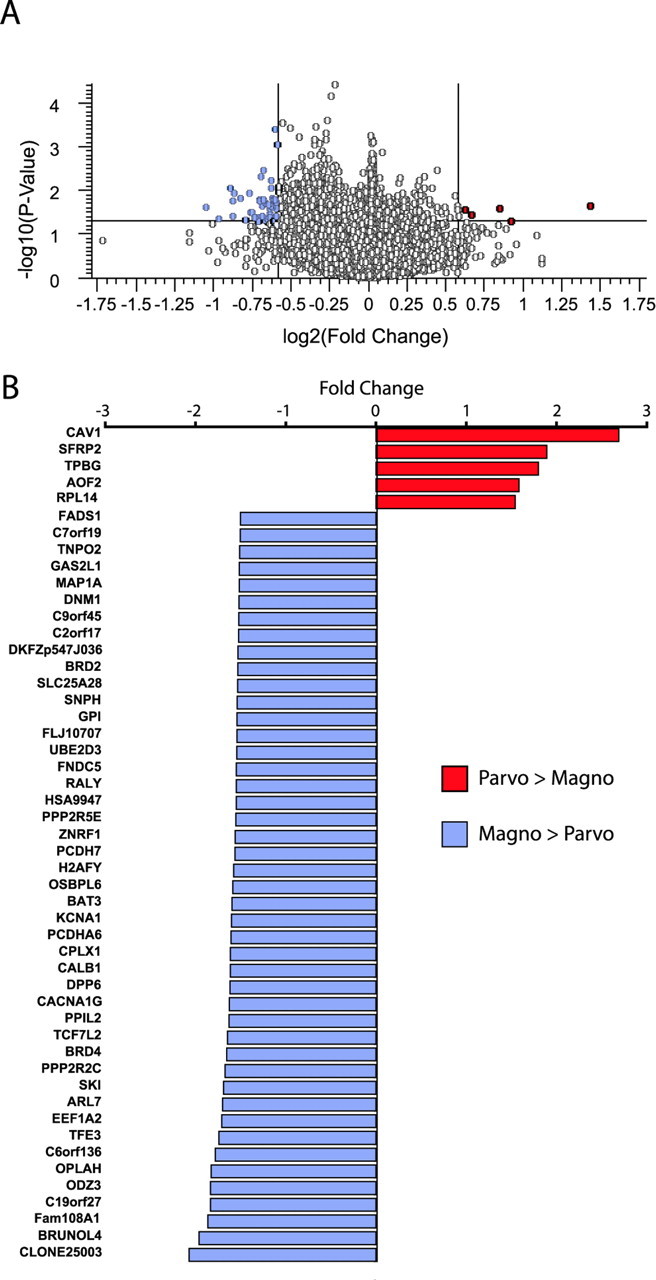
Figure 3.

Genes differentially expressed in dLGN layers identified by microarray analysis. A, Volcano plot of robust multichip analysis and median polished Affymetrix GeneChip data. Fold expression levels between magnocellular and parvocellular layers are plotted on the x-axis (log2 transformed) and t statistic p values are plotted on the y-axis (−log10 transformed). Genes that displayed at least a 1.5-fold difference and a value of p < 0.05 are indicated in the top left and right quadrants of the plot. B, Genes identified in the volcano plot as having matched the cutoff criteria are hierarchically listed here by fold increase in parvocellular layers (red) compared with magnocellular layers (blue).
