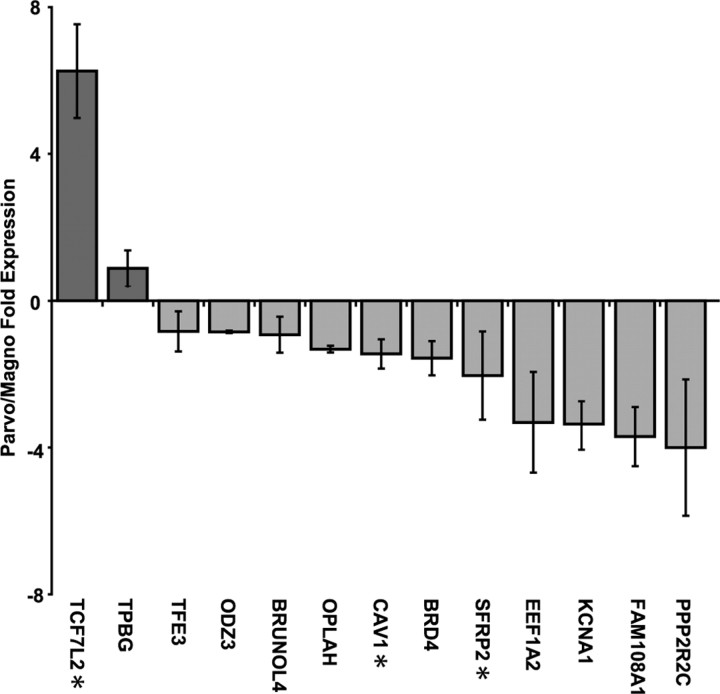
Figure 4.
RT-PCR confirmation of microarray measures. Twelve of the top genes identified by microarray were analyzed independently by RT-PCR. Each gene was measured in triplicate and plotted as fold increase in parvocellular (dark gray) expression levels over magnocellular (light gray) expression. Genes with fold differences opposite those observed by microarray are indicated (*). The bars indicate mean values ± SEM.

