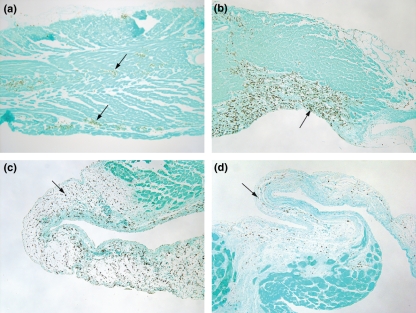
Figure 5.
Histology of the right ventricular outflow tract seen with CD68 immunohistochemistry identifying monocyte/macrophage cells. (a, arrows) CD68+ cells are in clusters in the right ventricular outflow tract at day 1 after PE, (b, arrows) aggregated in regions of damage at day 4 after PE, (c, arrow) in the debrided, thinned outflow tract week 1 after PE and (d) in the loose connective tissue above the developing fibres seen on the endocardial side 6 weeks after PE. Sections are serial to those in Figures 6 and 7. Endocardial side is downward.

