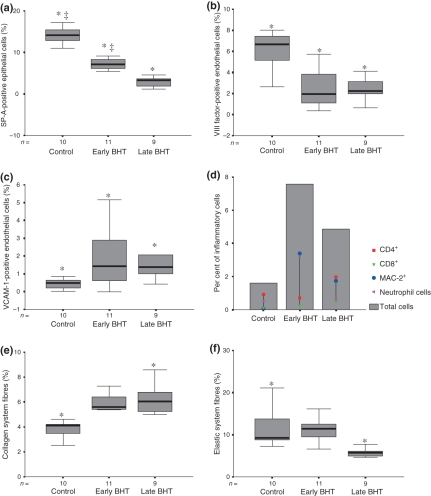
Figure 5.
Graphic illustration of type II pneumocytes density (SP-A) (a); microvascular density (VIII factor) (b); vascular adhesion molecule (VCAM-1) (c); inflammatory cells density (d); collagen system fibres density (e); and elastic system fibres density (f) in experimental BHT model and control group. Statistical significance (*) between control groups and early and late BHT group, statistical significance (‡) between early and late BHT group.

