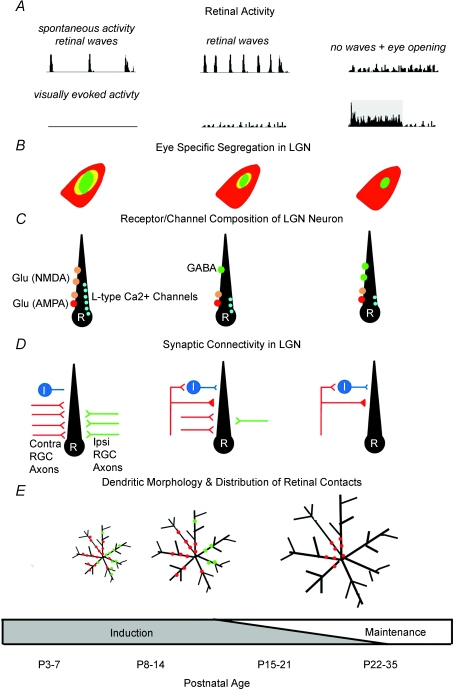
Figure 1. Summary of retinogeniculate refinement.
The major events and changes that occur along the retinogeniculate pathway during the first few weeks of postnatal life are shown. In A, spontaneous and visually evoked retinal activity, are displayed as poststimulus time histograms. The shaded region represents the response to a visual stimulus. In B, D and E, red and green represent retinal inputs arising from the contralateral and ipsilateral eye, respectively. In B, yellow depicts regions of overlap. In C and D, LGN neurons labelled I and R depict interneurons and relay cells, respectively. In D, weak and strong retinal inputs are displayed as opened and filled symbols, respectively.

