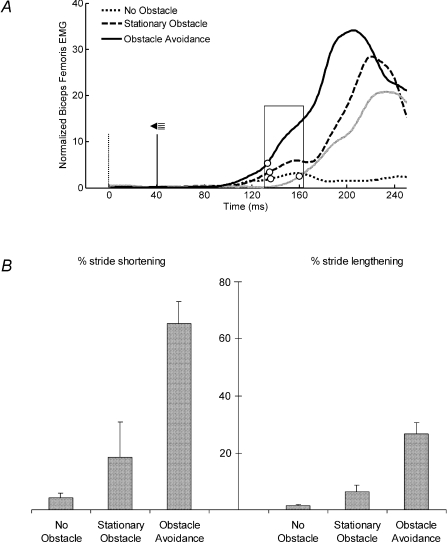
Figure 5. Responses to startling auditory stimulus in obstacle conditions.
A, averaged EMG data of all subjects for biceps femoris in three different startle conditions (no obstacle, stationary obstacle and obstacle avoidance). Obstacle avoidance condition without startle (grey trace) is added for comparison. Open circles in the traces indicate mean onset latency of each condition. The vertical dotted line indicates the obstacle release moment. The vertical continuous line shows when the startle was given. The time window used to compare the amplitudes of the various conditions is indicated by a box. B, mean percentages and standard deviation of stride shortening or lengthening for startle conditions.

