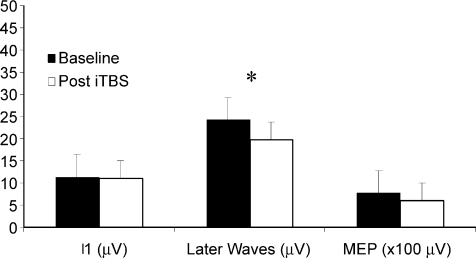
Figure 3. Histograms showing grand mean amplitudes of the I1-wave, of the later I-waves (the sum of the amplitudes of waves following I1) and of motor-evoked potentials in baseline conditions and after 1 Hz rTMS in the five studied subjects.
The amplitude of later I-waves is significantly reduced after rTMS (* P < 0.05). The amplitude of MEPs is also reduced by about 20% after rTMS. The amplitude of the I1-wave is unchanged.

