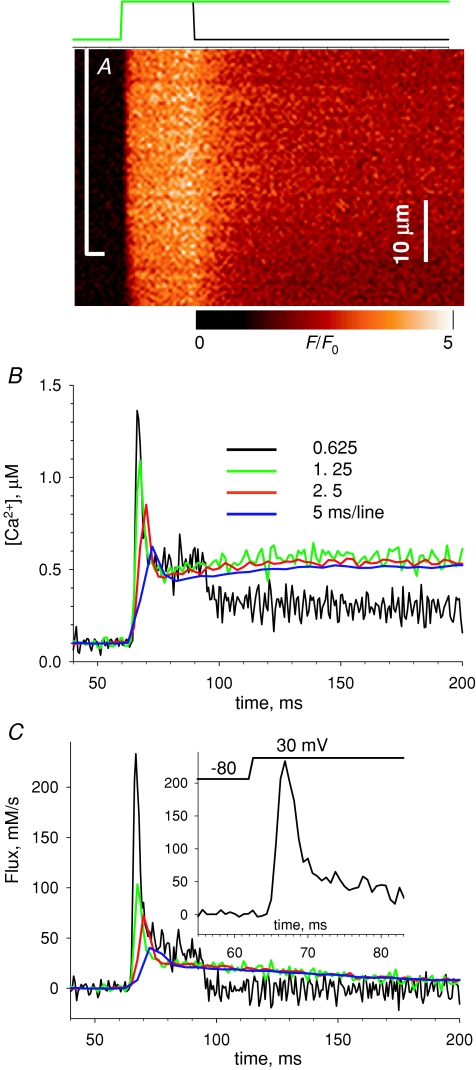
Figure 3.
Images acquired at different scan frequencies A, F(t)/F0 in a cell with rhod-2, stimulated by a 30 ms pulse to + 20 mV, scanned at 0.625 ms line−1. B, [Ca2+]cyto(t), calculated by eqn (1) (black). Three other records, in colour, were derived from images acquired at lower scan frequencies, as listed in the figure. In these cases the depolarizing pulses were 200 ms long, to +30 mV. In all cases, the fluorescence was averaged in the region marked with the bracket in A, to avoid an area of lower intensity. C, release flux records derived from the Ca2+ transients in B. Parameters: kuptake= 6900 s−1, kE= 14 μm−1 s−1, k−E= 7.0 s−1. EGTA was assumed to be 0.7 of the concentration in the pipette, or 7 mm. Inset, detail of record at the highest frequency. Trace at top marks actual timing of depolarization. Experiment 021408a, records 13, 15, 16, 17.

