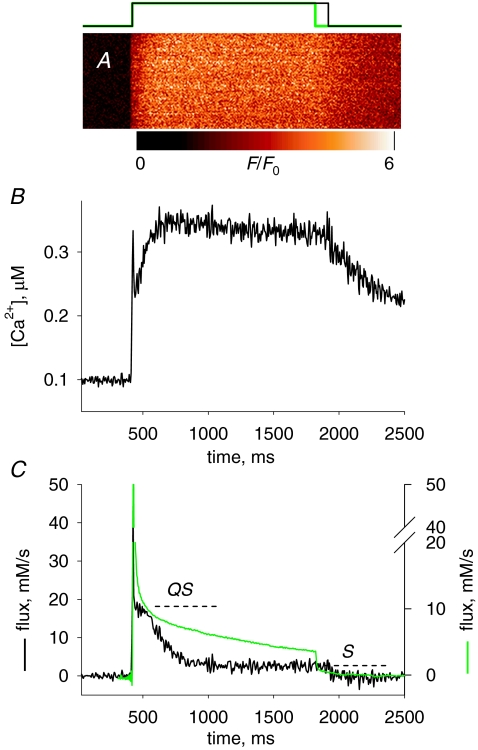
Figure 4.
The Ca2+ transient and Ca2+ release induced by a depolarization of long duration A, normalized line scan F(x,t)/F0(x) in a cell with rhod-2 stimulated by a 1500 ms pulse to +20 mV (represented in black at top). B, [Ca2+]cyto(t) derived from the averaged fluorescence. Note a virtual stabilization after ∼250 ms. C, black trace, release flux, derived from the record in B. QS is the ‘pedestal’ level reached after a fast relaxation from the peak and S the steady level, also referred to as ‘cycling’ level. Parameters: kuptake= 4900 s−1, others as in previous figure. Experiment 122606a, record 36. Green trace, flux calculated from Ca2+ transient elicited in a frog semitendinosus fibre, voltage clamped in a 2-Vaseline gap, depolarized for 1400 ms to +60 mV (pulse in green at top of figure, data from Pizarro & Ríos, 2004; fibre identifier 1276). Records scaled so that their initial plateaus (QS) overlap.

