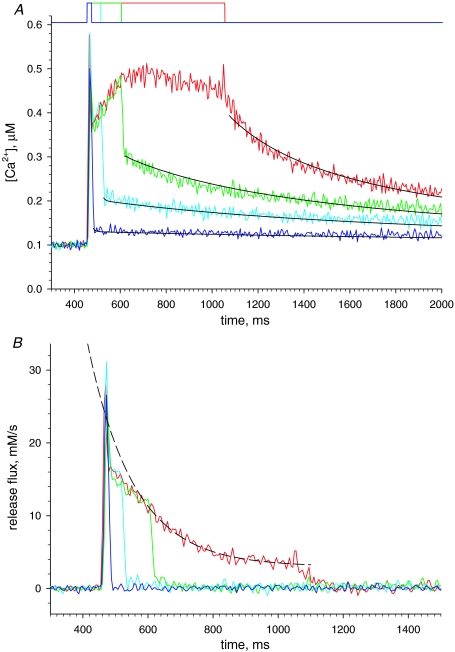
Figure 5.
A reliability test of the flux calculation A, [Ca2+]cyto(t) derived from fluorescence of rhod-2 in a cell subjected to the pulses shown at top, to +30 mV for 20, 60, 150 or 600 ms. The black lines represent fits to the OFF portion of the records, with parameters: kuptake= 7230 s−1, kE= 11.0 μm−1 s−1, and k−E= 4.90 s−1. EGTA was assumed to be 0.7 of the concentration in the pipette, or 7 mm. B, release flux calculated from records in A. The good quality of the fit of the Ca2+ transients is manifested in the fact that calculated Ṙ (t) decay abruptly and monotonically to zero at the end of the pulses. The good fit at intermediate durations (20, 60 and 150 ms) establishes the reliability of the kinetic features of the flux, in particular the change in curvature, at those times. The dashed line, an exponential of time constant 142 ms and asymptote 2.15 mm s−1, fits well the later portion of Ṙ (t), starting 150 ms after the leading edge of the 600 ms pulse. Experiment 091207b, records 21–24.

