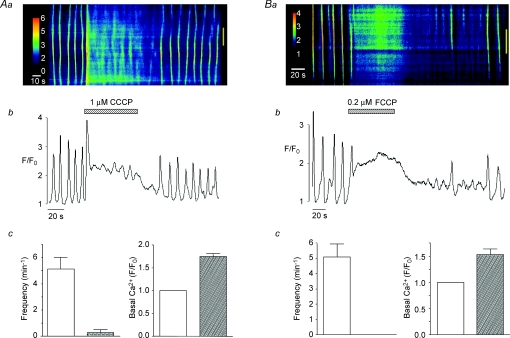
Figure 2. Effect of protonophores on spontaneous Ca2+ waves in urethra ICC.
A line-scan image showing the effect of CCCP (1 μm) on spontaneous Ca2+ waves is shown in Aa. Ab shows an intensity profile plot of this record. Summary bar charts plotting the mean frequency (min−1) of Ca2+ waves and basal Ca2+ levels (F/F0) in the absence and presence of CCCP are shown in Ac. Ba–c shows that FCCP produces similar effects to CCCP.

