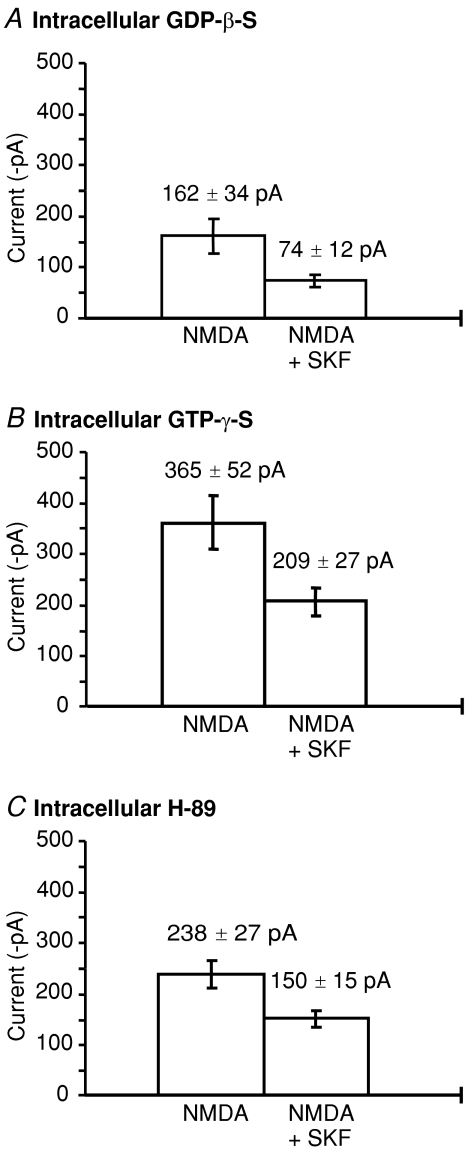
Figure 3. G proteins and PKA are not involved in D1 inhibition of NMDA responses.
A, mean current (±s.e.m.) in the presence of intracellular GDP-β-S (0.5 mm) of the first NMDA response compared to the second response in the presence of SKF-82958 and spiperone (n= 9, P < 0.05). B, mean current (±s.e.m.) in the presence of intracellular GTP-γ-S (0.5 μm) of the first NMDA response compared to the second NMDA response (n= 10, P < 0.05). C, mean current (±s.e.m.) in the presence of intracellular H-89 (5 μm) of the first NMDA response compared to the second NMDA response in the presence of SKF-82958 and spiperone (n= 7, P < 0.05).

