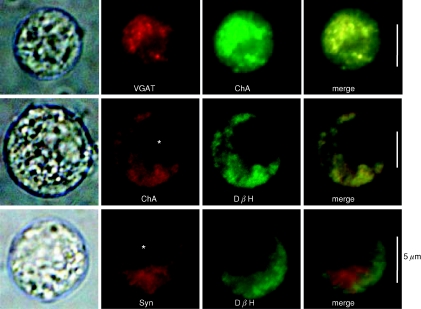
Figure 2. The presence of VGAT in chromaffin granules.
1st column represents transparent images for each rat AM cell; the 2nd and 3rd columns show rhodamine-like and FITC-like fluorescence images for immunoreaction. 4th column indicates merge of the 2nd and 3rd column images. Colocalization of immunoreactions with different Abs is shown in yellow. Cells were treated with a rabbit anti-VGAT Ab and then with goat anti-chromogranin A (ChA) or with rabbit anti-dopamine-β-hydroxylase (DβH) and then the anti-ChA Ab or a mouse anti-synaptophysin (Syn) mAb. Asterisks indicate the nucleus. The experiments were repeated at least three times.

