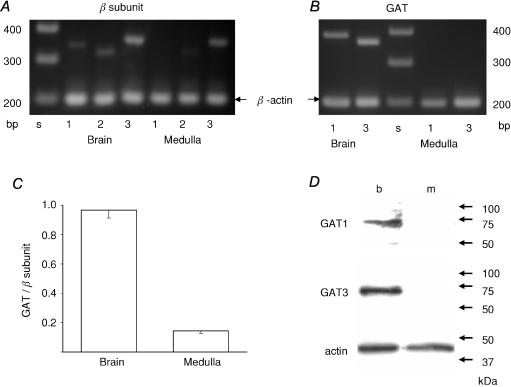
Figure 8. Absence of GAT expression in rat adrenal medulla.
A, electrophoresis of the PCR products of rat brain and adrenal medulla cDNAs for β1, β2 and β3 subunits, and β-actin. B, electrophoresis of PCR products for GATs and β-actin. C, summary of ratios of totals of the relative amounts of PCR products for GAT1 and GAT3 to those of relative amounts of PCR products for β1, β2 and β3 subunits. The amounts of PCR products for GATs and β subunits were expressed as fractions of the amounts of PCR products for β-actin (see Methods). Data represent mean ±s.e.m. (n= 3). D, immunoblot for GAT1 and GAT3 of homogenates of rat brain (b) and adrenal medulla (m). Immunoblotting for actin was performed to confirm that the same amount of proteins (6 μg) was loaded for each lane.

