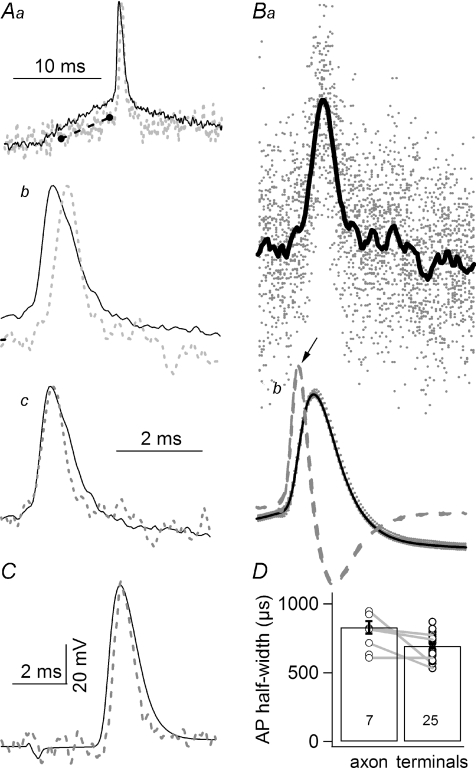
Figure 4. The duration of action potentials in terminal branches is shorter than that recorded in the main branches of axons.
Aa, superimposed F traces recorded from the secondary axon (continuous line), same location as the V electrode, and terminals (dashed grey line) of the same preparation. The action potential was evoked by a current injection step from resting membrane potential. Both traces are the average of 22 traces. The black dashed line marks the shallower slope of the rising phase of the terminal recording as compared to that of the axonal recording, indicating spatial decay of the subthreshold signal. Note that both traces are fluorescence transients, to ensure identical filtering characteristics of the recordings. Ab, action potentials shown in Aa are displayed on an expanded time scale. The two action potentials cross each other in their falling phases but the terminal action potential exhibits a later onset, due to conduction delay. Ac, the two action potentials shown in Ab are normalized and aligned in their rising phase, to better demonstrate the reduced duration of the terminal action potential. All traces in A are in arbitrary units, not shown. Ba and b, an illustration of the alignment procedure. Ba, individual F traces, dotted (n= 24), and the average calculated from these traces (continuous line) are superimposed. These traces have already been aligned. Bb, superimposed action potentials recorded with a microelectrode. Two action potentials are shown using different symbols. Dashed traces represent derivatives of the E traces. One thousand data points, at 50 μs sampling, before and 2000 points after the maximum (arrow) were then duplicated into a new file for data averaging. The same data point indexing was used for duplication and averaging of F traces recorded simultaneously. C, another example of action potential comparison between an E trace recorded in the secondary axon and the corresponding F trace recorded in the terminals. In this case, action potentials were evoked by suction electrode stimulation. The characteristic narrower terminal action potential is also present. Therefore, the shorter duration of the terminal action potential is independent of the method used to initiate the action potentials. D, comparison of axonal and terminal action potential half-widths. The duration of action potentials measured in terminals is significantly (P < 0.01, Student's t test) shorter than the duration of those recorded in secondary axons. Only fluorescence transients, not E traces, were included when averaging axonal half-widths. Numbers in histogram columns are sample sizes.

