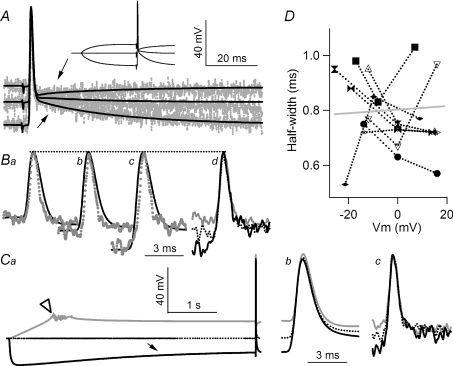
Figure 5. A shift in resting membrane potential does not modulate action potential duration.
A, action potentials evoked by suction electrode stimulation were delivered during resting, depolarizing and hyperpolarizing resting membrane potentials, inset. Superimposed E (continuous lines) and F (dotted) traces show that the DAP could be inverted or enlarged (arrows) and is detected in both E and F traces. Ba–c, superimposed E and F traces of action potentials recorded from depolarized, resting and hyperpolarized membrane potential, respectively. The dashed line highlights that the peak of action potential is not affected by resting level of membrane potential. Bd, superimposed F traces of action potential showing that the duration of action potentials is not affected by the levels from which action potentials take off. Ca, test of action potential modulation by prolonged pre-potentials. The axon was depolarized by an initial ramp to minimize firing, although action potentials did occur in some traces (open arrowhead). Prolonged hyperpolarization activated an Ih-mediated sag (arrow). E (Cb) and F (Cc) traces of action potentials displayed on an expanded time scale show no modulation in action potential duration as a result of the prolonged conditioning. D, half-widths of action potentials measured in terminals do not correlate with resting membrane potential recorded in the secondary branch. The correlation coefficient of all data points (24) is 0.054 and is insignificant (P > 0.5). Zero on the X-axis represents resting membrane potential. Data points measured from the same terminals are connected, and each terminal is represented by a different symbol. Open symbols were obtained from experiments where prolonged, 5 s, prepulses were used. Traces in A and B share the same vertical scale. All traces in C share the same vertical scale. All recordings in this graph were obtained from the same preparation and were all averaged from 20 traces.

