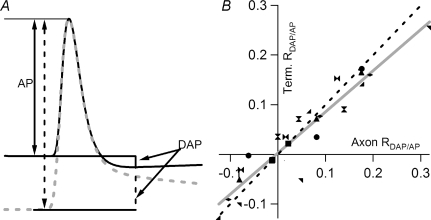
Figure 7. DAP amplitude and polarity co-vary in terminals and axons.
A, quantification of DAP as the membrane potential is shifted. In order to compare results recorded form different preparations, DAP was normalized by the amplitude of the action potential, measured from the baseline to peak (AP). Using microelectrode-recorded E traces in the secondary axon as a common reference, the DAP was measured at the minimal point following an action potential fired from depolarized membrane potential (continuous line). The same time point was then used to measure DAP following an action potential fired from hyperpolarized membrane potential (grey dashed line). The same time point was also applied to the DAP measured from F traces recorded simultaneously. B, correlation between the RDAP/AP measured from terminals and axons. RDAP/AP measured from F traces significantly correlates with that recorded with the microelectrode in the axon. A linear fit has a slope of 0.83, which is significantly different from 1 (P < 0.01), and a correlation coefficient of 0.94, which is also significant (P < 0.01). The dashed straight line represents the 45 deg line. The plot was compiled from 8 preparations, each shown with a different symbol, and each preparation contributed 3 points, i.e. 3 membrane potential levels. The linear fit was applied to all 24 data points.

