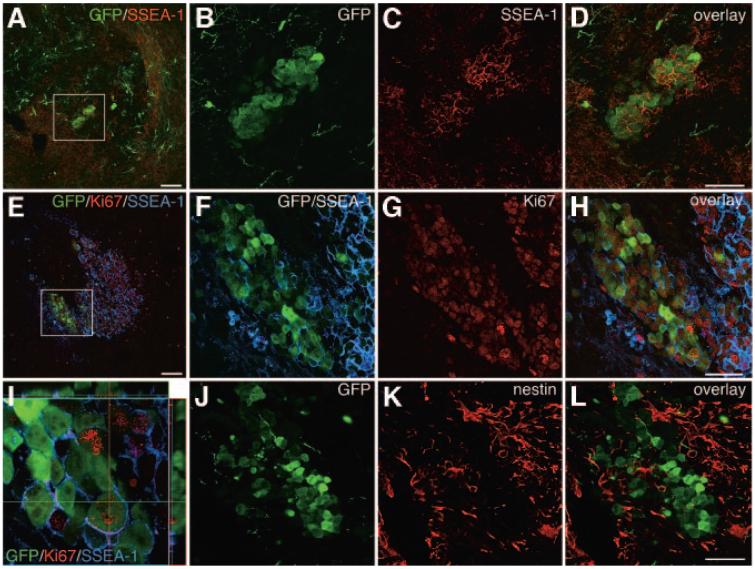
Figure 5.
Identification of proliferative eGFP+ cells in the grafts. (A-L): Analysis of mouse grafts 4 weeks post-transplantation showed that there were cluster of SSEA-1+/eGFP+ cells in some grafts ([A]; the boxed area is shown enlarged in [B-D]). Further analysis of the rat grafts 10 weeks post-transplantation showed that many eGFP+ cells were Ki67+ as well as SSEA-1+ ([E-I]; [F-H] show enlargements of [E], and [I] is an orthogonal view; co-expression of Ki67 and eGFP appears yellow). Staining for neural progenitors showed that the grafts contained many nestin+ cells (K, L) but that few of these cells were eGFP+ (J, L). Scale bars = 100 μm (A, E) and 50 μm (D, H, L) (scale bar in [D] applies to [B, C], that in [H] applies to [F, G], and that in [L] applies to [J, K]). Abbreviations: GFP, green fluorescent protein; SSEA, stage-specific embryonic antigen.

