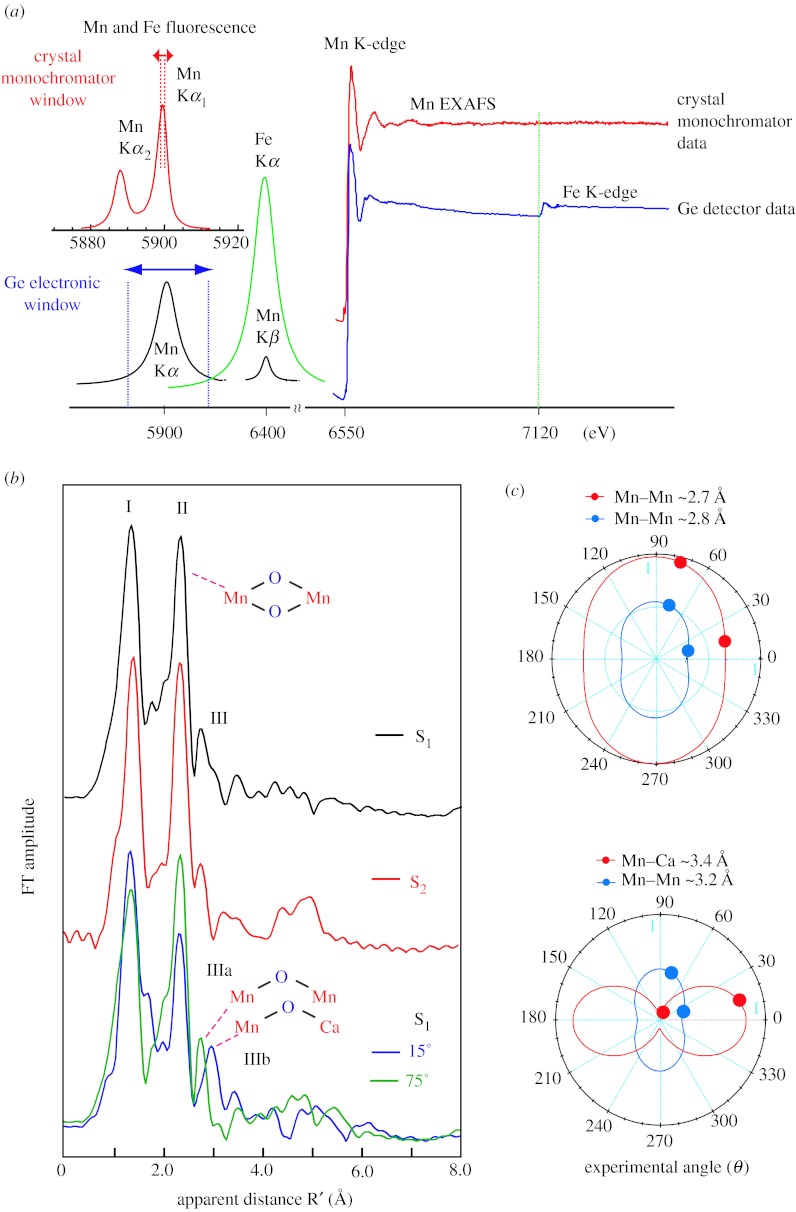
Figure 3.
(a) A schematic of the detection scheme. Mn and Fe Kα1 and Kα2. The multi-crystal monochromator with approximately 1 eV resolution is tuned to the Kα1 peak (red). The fluorescence peaks broadened by the Ge-detector with 150–200 eV resolution are shown below (blue). Right: The PSII Mn K-edge EXAFS spectrum from the S1 state sample obtained with a traditional energy-discriminating Ge-detector (blue) compared with that collected using the high-resolution crystal monochromator (red). Fe present in PSII does not pose a problem with the high-resolution detector (the Fe edge is marked by a green line). (b) Fourier transform (FT) of Mn K-edge EXAFS spectra from isotropic solution and oriented PSII membrane samples in the S1, S2 and oriented S1 state obtained with a high-resolution spectrometer (range-extended EXAFS). Angles indicate orientation of the membrane normal with respect to the X-ray e-field vector. The k range was 3.5–15.2 Å−1. (c) Polar plot of the X-ray absorption linear dichroism of PSII samples in the S1 state. The Napp values (solid circles) for oriented membranes are plotted at their respective detection angles (θ). The best fits of Napp versus θ to the equation in the text are shown for the various Mn–Mn vectors as solid lines that take into account the experimentally determined mosaic spread of Ω=20°.

