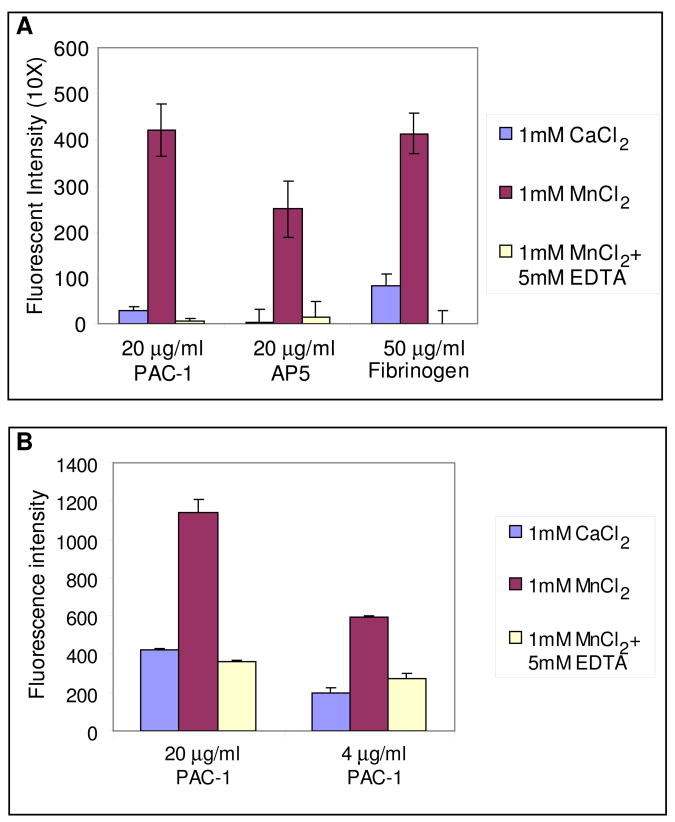
Figure 3.
Results of integrin activation assay using antibody PAC-1, antibody AP5 and fibrinogen. Each measurement is the average of 3 repeats and the error bars in the figure show the range of data. (A) Assay comparing binding to PAC-1, AP5 and fibrinogen. (B) Assay comparing different loadings of PAC-1 to the assay well.

