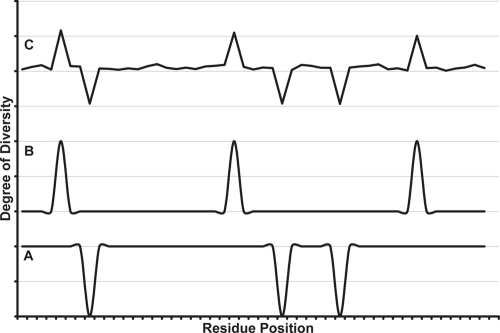
Figure 1.
Different degrees of conservation for different cases: A) distant orthologs with the same function or specificity; B) closely related paralogs with different functions or specificities; C) closely related paralogs in a family, with a common function but different specificities (e.g. P450). The down peaks in A correspond to the totally conserved and hence functionally important residue positions. The peaks in B correspond to specificity-determining residues (SDRs). Peaks in C have the same meaning as in A and B. Higher (upward) peaks indicate lower degrees of conservation (higher degrees of diversity). The figure is for illustration of the concept, and arbitrary scales are used.

