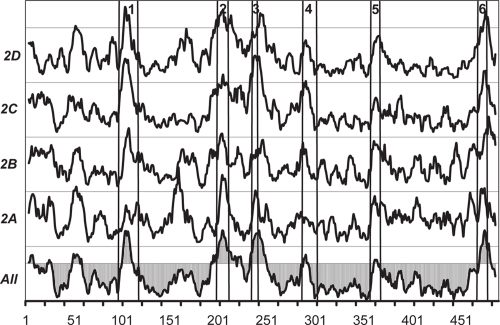
Figure 2.
The W scores (defined in Eq. 1) for the whole CYP 2 family (marked All) and subfamilies. The score (y) axis is for visual comparison; the units are not shown since they are not relevant (the same applies to all figures). The horizontal axis indicates the residue position. The numbers at the top of the figure and the vertical lines indicate the SRS regions defined by Gotoh (Gotoh, 1992). A cutoff of 0.5 standard deviation unit is shown for the W score of the whole CYP 2 family (marked All). The peaks above this cutoff clearly correspond to the SRS regions.

