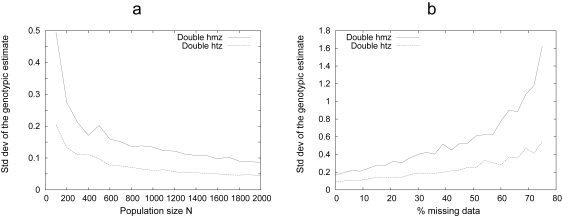
Figure 3. Impact of the quality of the data set on the results.
The effect of the population size and the proportion of missing data on the quality of the results is illustrated by the standard deviation of the 2-locus GP map estimates. The amplitude of uncertainties changes with the genotype considered, since the more frequent in the F2 population, the better the estimate of the genotypic value. The results for the ‘best’ genotype (i.e. the fully heterozygous (‘htz’) genotype 22) and one of the the ‘worse’ ones (fully homozygous (‘hmz’) 11) are displayed. a: improvement in the precision of the GP map when the size of the population under study is increased. b: effects of substituting (randomly) genotypic information (2 loci, N = 500) by missing data. In this example (Var(e) = 1, additive GP map), fairly good estimates of the genotypic values in a 2-locus GP map requires N > 400, and these estimates appear to be quite robust to missing data information. The corresponding script is available in the Appendix.

