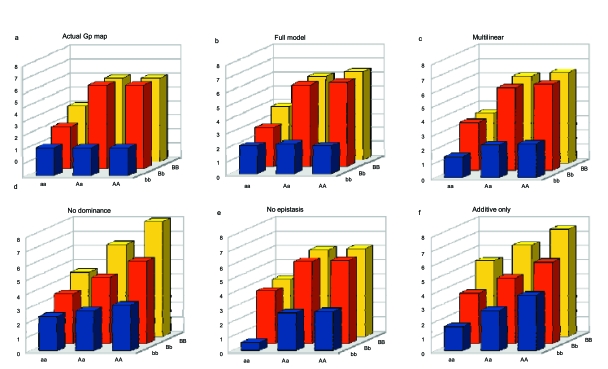
Figure 5. Illustration of the consequences of reducing the complexity of GP maps.
An F2 population (size N = 500, Var (e) = 1) has been simulated from an arbitrary 2-locus, 2-allele (a and A at the first locus, b and B at the other one) GP map (panel a). The inferrence of the GP map from this population with different regression options is displayed in panels b to f (see the Appendix for the corresponding R script). b: Full model (9 parameters), explains 77.7% of the total phenotypic variance; c) multilinear model (6 parameters, 74.3%); d) no dominance (i.e. only additive and additive-by-additive interactions) (4 parameters, 55.9%); e) no epistasis (5 parameters, 70.8%); f ) additive effects only (3 parameters, 54.9%). The full model always performs better (results identical to the actual GP map except sampling effect). The relative performance of the other models obviously depends on the shape of the actual GP map. If the decomposition is orthogonal, a model selection procedure can be performed to make a rational choice among all possible models.

