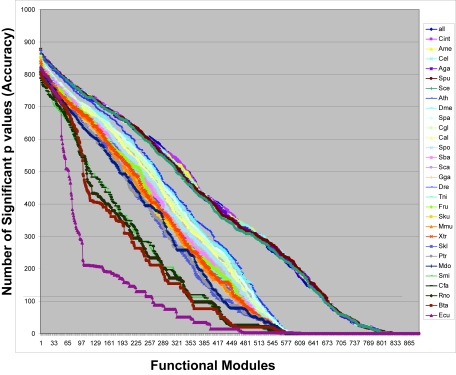
Figure 1.
The functional prediction accuracy of phylogenetic profiles from 30 different eukaryotic genome sets. Accuracy was determined by t-test comparison of average hamming distance for phylogenetic profiles within a functional module versus phylogenetic profiles in all 885 other functional modules. P values were adjusted to account for multiple testing by the method described in (Storey, 2002). The plot depicts the number of corrected p values per functional module and demonstrates that there are 4 zones of decreasing accuracy within which the level of performance of each phylogenetic profile for predicting function is statistically indistinguishable, but between which the performance declines significantly.

