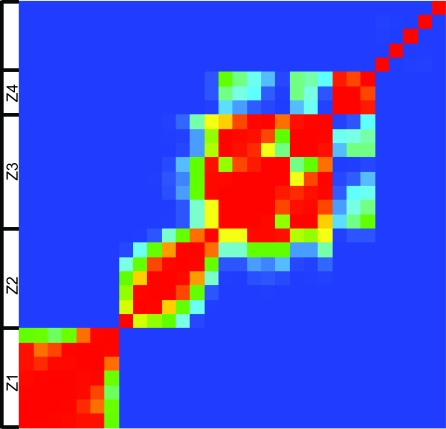
Figure 2.
Heatmap showing significant differences in the accuracy of the functional predictions made by 30 different genome sets tested in the present study. Significance was measured by Kolmogorov-Smirnov (KS) tests. Red indicates an insignificant p value = 1, Blue represents a significant p value = 0. The 4 large zones of accuracy also evident in Figure 1 are shown here to differ significantly with all KS-test p values < 0.01 (Z1–Z4).

