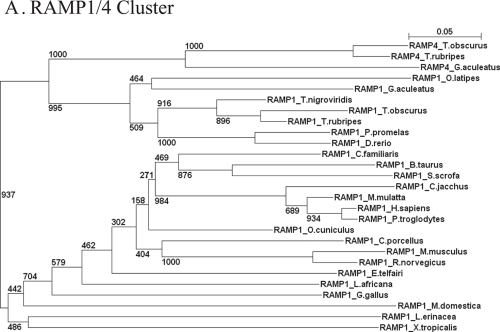
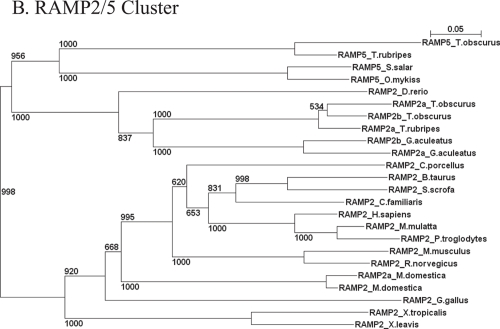
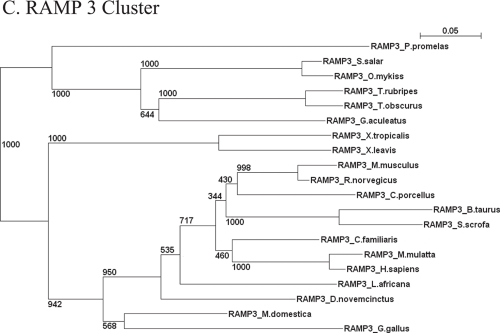
Figure 1. Phylogenetic analyses of separately RAMP clusters.
Phylogenetic analyses of different RAMP clusters were firstly submitted through the Prottest application (Abascal et al. 2005) to confirm the best model for each cluster. A—The bestfit for Cluster RAMP1/4 was the Jones Thorton Taylor model plus Gamma distribution plus amino acids frequencies [JTT+G+F]. B—Best model explaining phylogeny of cluster RAMP2/5 was determined by JTT+G one. C—Phylogeny in cluster RAMP3 was resolved by JTT+I [Invarianted frequencies]+ G model. Branches reflect phylogenetic distances and bootstraps over 1000 replicates.


