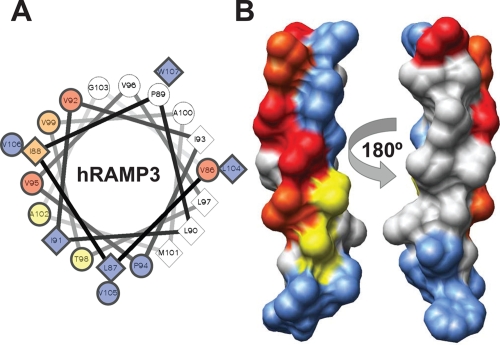
Figure 5. Type-0/Type-I/Type-II residue distributions on transmembrane helix.
Residues under Type-0, Type-I, and Type-II functional divergences were drawn in a helical wheel plot of the human RAMP3 transmembrane helix. A—Helical wheel plot showing Type-0 [blue shaded symbols], Type-I residues [red shaded symbols], and Type-II residues [yellow shaded symbols]; orange shaded symbols represents residues with Type-I and Type-II prediction at same time. B—Molecular surface representation of transmembrane helix showing a biased distribution of type-0, type-I, and Type-II residues; color of residues is maintained according to Figure 5A.

