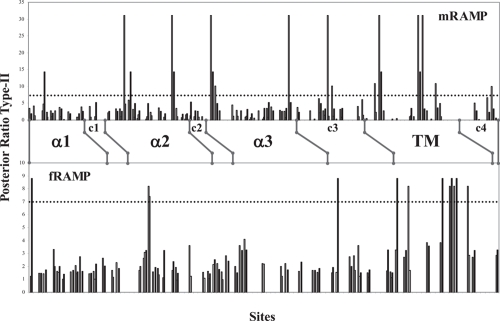
Figure 6. Site-specific profile of Type-II functional divergence of RAMP proteins.
According to procedure used in type-I analysis, the multiple alignments of each RAMP group were processed by DIVERGE 2.0 (Wang and Gu, 2001) to collect type-II functional divergence data. The posterior ratios retrieved from this analysis were plotted separately for each group. The dashed line shows the threshold value for significant residues under type-II functional divergence. mRAMP = RAMP proteins from mammals. fRAMP = RAMP proteins from fishes. White, grey, and black bars show the scores for the RAMP1/RAMP2, RAMP1/RAMP3, and RAMP2/RAMP3 pairwise comparisons respectively. Secondary structures are defined for each group; non homogeneous distribution was caused by loss of type-II information for some residues.

