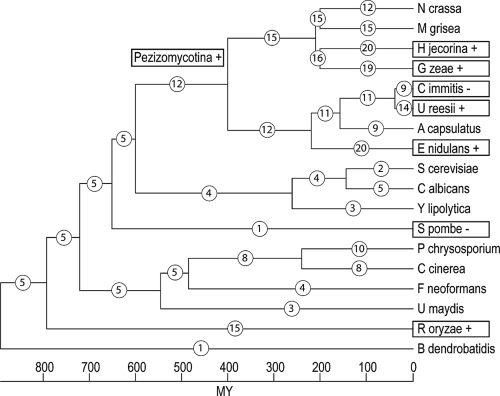
Figure 1.
Distribution of GH18 gain and loss among fungal lineages. Phylogenetic relationships among the fungal species used in the current study are shown, including divergence dates in millions of years (Taylor and Berbee, 2006). Circled numbers represent total number of GH18 genes in extant species and estimates of total number of GH18 genes for ancestral species. Boxed taxon names indicates a significant (p-values ≤ 0.05 or Likelihood ratios >50) expansion (+), or a significant contraction (−) of the GH18 gene family size.

