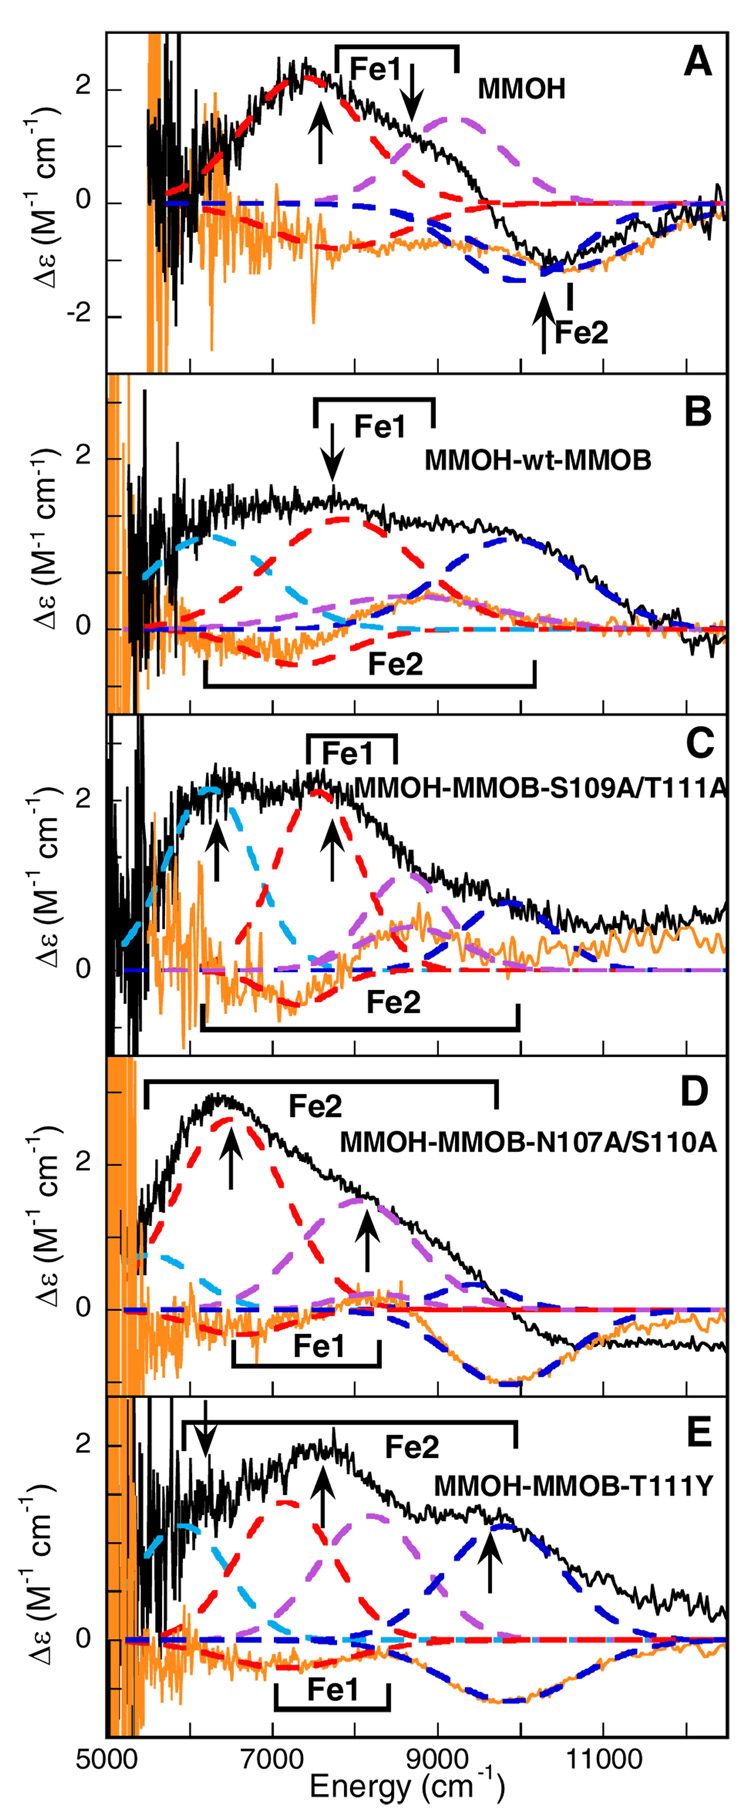
Figure 2.
CD and MCD spectra of the binuclear non-heme Fe(II)Fe(II) active site in (A) MMOH, (B) MMOH-wt-MMOB, (C) MMOH-MMOB-S109A/T111A, (D) MMOH-MMOB-N107A/S110A, and (E) MMOH-MMOB-T111Y. The experimental CD (orange solid lines) and MCD data (black solid lines) are simultaneously fit to individual Gaussian band shapes (colored --- lines). The arrows mark the energies where the VTVH MCD data were collected and the labels show the bands corresponding to Fe1 and Fe2 centers.

