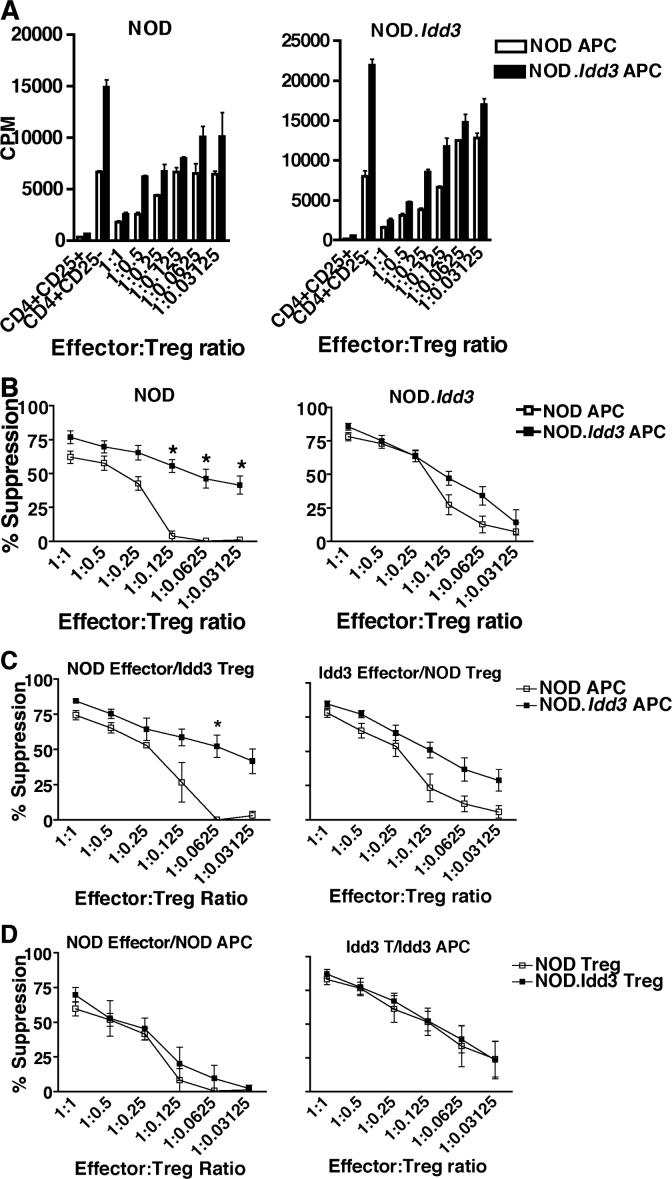
Figure 3. NOD.Idd3-derived antigen presenting cells drive enhanced suppression.
A) CD4+CD25+ Tregs and CD4+CD25− effectors from NOD (left panel) and NOD.Idd3 (right panel) were cultured with soluble anti-CD3 and irradiated APC from either NOD (open bars) or NOD.Idd3 (closed bars). Similar results were obtained in 5 independent experiments. B) Percent suppression of NOD (left panel) and NOD.Idd3 (right panel) Tregs cultured with NOD (open squares) and NOD.Idd3 (closed squares) APC. The mean of five independent experiments is shown. *p=0.0079. C) Percent suppression of NOD effectors by NOD.Idd3 Tregs (left panel) and of NOD.Idd3 effectors by NOD Tregs (right panel) cultured with NOD (open squares) or NOD.Idd3 (closed squares) APC. The mean of three (left panel) and 5 (right panel) independent experiments is shown. *p=0.02. D) Percent suppression by NOD (open squares) versus NOD.Idd3 (closed squares) Tregs of either NOD effectors cultured with NOD APC (left panel) or NOD.Idd3 effectors cultured with NOD.Idd3 APC (right panel). The mean of 4 (left panel) and 3 (right panel) experiments is shown.

