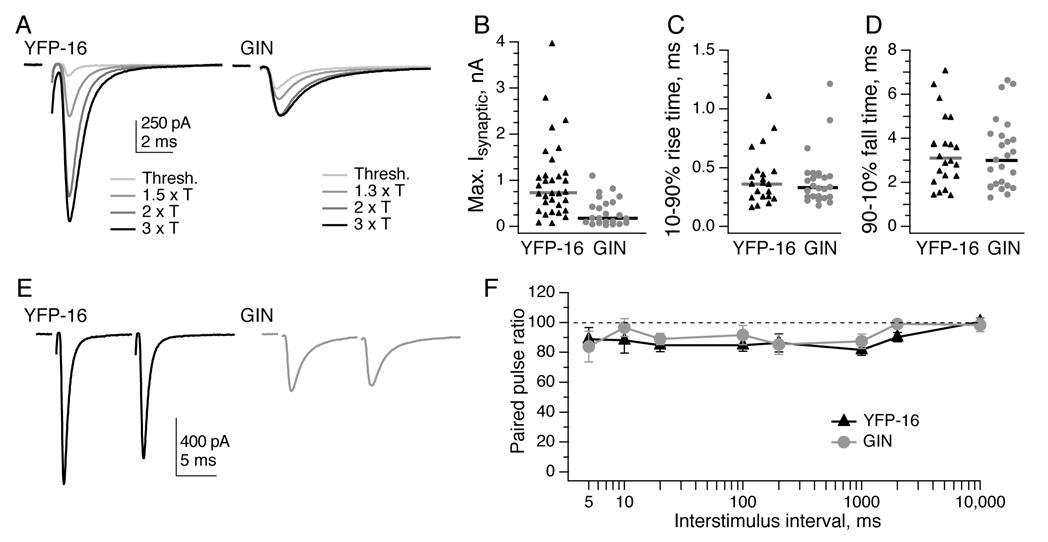
Figure 2. EPSCs from vestibular afferents exhibit rapid kinetics and little paired-pulse modulation.
A, Example EPSCs resulting from increasing stimulation intensities of the vestibular nerve in slice preparation, recorded from neurons labeled in the YFP-16 line (left) and the GIN line (right). Stimulation artifacts are blanked for clarity. T = threshold stimulation intensity. B, The maximum EPSC amplitude that could be elicited in YFP-16 neurons was 3-fold higher than that in GIN neurons (p < 0.0001). Two YFP-16 neurons had maximal EPSCs of 5–6 nA (not shown for graphical clarity). C, EPSC 10–90% rise times are rapid both in YFP-16 neurons and GIN neurons. D, EPSC 90–10% decay times (see Experimental Procedures) are also swift in YFP-16 and GIN neurons. Kinetics were usually measured at 1.5–3x the threshold stimulation intensity. Horizontal bars represent medians. E, Paired pulse. Examples of EPSCs elicited at a 10 ms interval in a YFP-16 (left) and GIN (right) neuron. F, Summary of paired-pulse ratios (100*EPSC2/EPSC1) across interstimulus intervals from 5 ms to 10 s. EPSCs in both YFP-16 and GIN neurons depressed to ~85% of their original values at stimulus intervals from 5 ms to 1 s, with no history dependence visible at intervals of 10 s. N = 3–10 cells per data point. Data are shown as mean ± SEM in this and subsequent figures.

