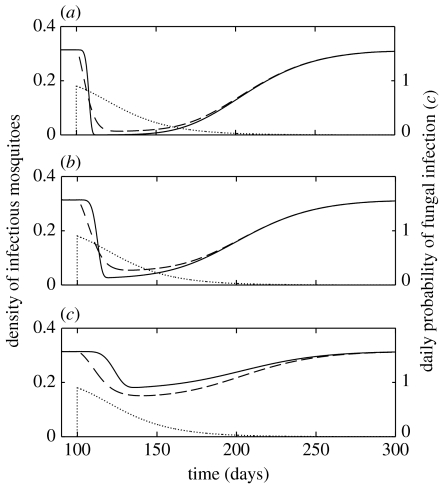
Figure 5.
The density of infectious mosquitoes following a single application of biopesticide spray on day 100. Three different values of the mean time to death if the fungus is the only mortality source (gF; high values imply low virulence) are plotted: (a) gF=7.5 days; (b) gF=12.5 days; and (c) gF=25 days. Solid and dashed lines represent β=5.5 and 1.5, respectively. Dotted lines show the change in the daily probability of fungal infection (c=1−exp(−F)) as a function of time (F0=2.3 and γ=0.044).

