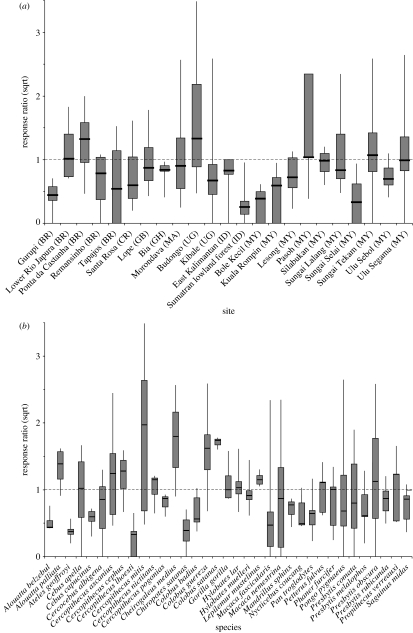
Figure 1.
Variation in response ratios (r) across (a) sites and (b) species. The response ratio is the population change in response to logging (calculated as the abundance in logged forest divided by the abundance in matching unlogged forest), where r=1 is no change, r>1 is an increase and r<1 a decrease, and r=0 is extinction. Median r values are shown by the black horizontal bars, interquartile ranges are shown by the grey vertical bars, and minimum and maximum values are indicated by the vertical lines. The y-axis is square-root transformed (sqrt, for ease of presentation). All sites and species where sample size n>2 are plotted. The sites are grouped by country and then by continent, from the Americas eastward to Africa and Asia: BR, Brazil; CR, Costa Rica; GB, Gabon; GH, Ghana; MA, Madagascar; UG, Uganda; ID, Indonesia; MY, Malaysia. The species are listed alphabetically.

