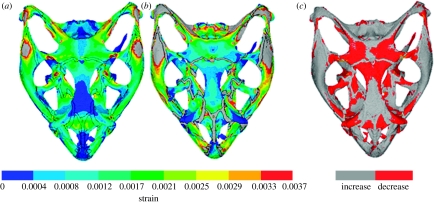
Figure 5.
Mean strain distributions considering the effect of all sutures. E refers to Young's modulus. (a) Model with all sutures fused (Ebone=Esuture=10 GPa), (b) model with all sutures unfused (Ebone=10 GPa; Esuture=10 MPa) and (c) a visual comparison in which grey and red show where the mean strain has increased or decreased, respectively, in (b) compared with (a). Note that the grey colour indicates strain larger than 0.0037 in (a,b).

