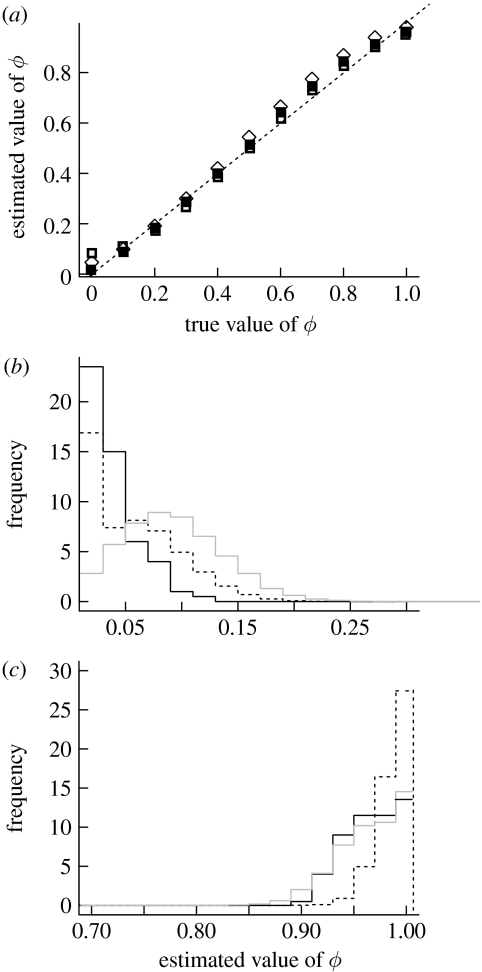
Figure 1.
Simulations to determine the extent of bias in the estimate of ϕ. A value of ϕ close to 0 indicates that the phylogenetic signal is stronger than the spatial signal and a value close to 1 indicates that the spatial signal is stronger. (a) Correspondence between observed and simulated values. The dashed line is the line of 1 : 1. The points represent data simulated for the different datasets used in the analysis (ν, carnivores; squares, artiodactyls; diamonds, primates). Simulated distributions of ϕ under a true distribution of (b) ϕ=0 and (c) ϕ=1.

