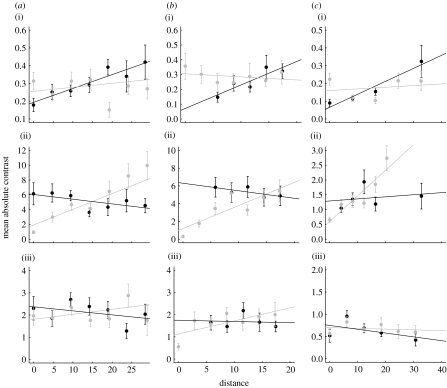
Figure 2.
Variograms of the relationship between geographical or phylogenetic distance and trait variance. ((a) carnivores, (b) artiodactyls and (c) primates: (i) body size, (ii) environmental temperature and (iii) range size.) The plots are constructed in the manner of a conventional variogram (e.g. Haining 1990), with data organized into distance intervals and then the mean variance in unstandardized contrasts calculated for data at each distance interval. Only density classes with more than 10 observations are included. The grey and black circles are variances calculated for groups based on geographical (spatial effect) and phylogenetic distances, respectively. The lines are regression lines. As with variograms, these plots are intended to be illustrative only. The formal tests of the parameter values are shown in figures 3 and 4. Table 2 summarizes the analyses.

