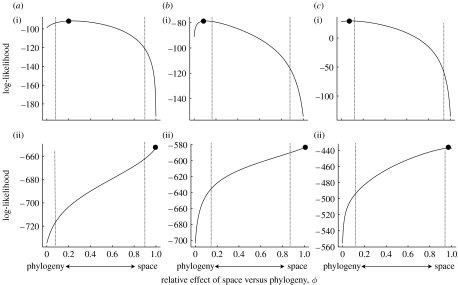
Figure 3.
Log-likelihood profiles for estimates of ϕ for the three datasets described in the text ((a) carnivores, (b) artiodactyls and (c) primates: (i) body size and (ii) environmental temperature). The lines show the log likelihood as ϕ is varied and the filled point indicates the maximum. Simulations were used to determine sampling intervals. The vertical dashed line on the right-hand side in each case shows the lower 2.5 per cent for the distribution when the true value is 1 and that on the left-hand side shows the upper 2.5 per cent for the sampling distribution when the true value is 0. Note that calculated this way, the type I error rate for each analysis is equal to 5 per cent when testing the composite hypothesis that the observed value is different from 0 or 1.

